Strategy Management Module
-
OKRs & Strategy Planning:
- Define 3 year strategic objectives and key results/KPIs, set annual targets
- Define annual OKRs, set sub-targets by month or quarter
- Classify leading vs lagging, rooftop vs moonshot targets
- Create strategic and operational OKRs and link them back to annual key results/KPIs
- Link child key results/KPIs using ‘Contributing’ vs ‘Aligning’ linking method (contributing cascades the metric up from child to parent, aligning cascades down from parent to child)
-
Key Result/KPI Management:
- Add details to each KPI / Key Result card such as (description, formula, source, polarity, owner, comments, sub-targets)
- Add sub-targets and view chart with target vs actual progress overtime
- Add weights for key results/KPIs to give them higher/lower impact
- Visually track target vs actual progress, automatic color coding (Red, Green, Yellow, Below) aligned with Adaa
- Lock an OKR card to stop future edits to the targets, description and other fields except allowed edits
- Right click on any KPI and add to executive dashboard to visualize it as a widget
-
Executive Dashboards:
-
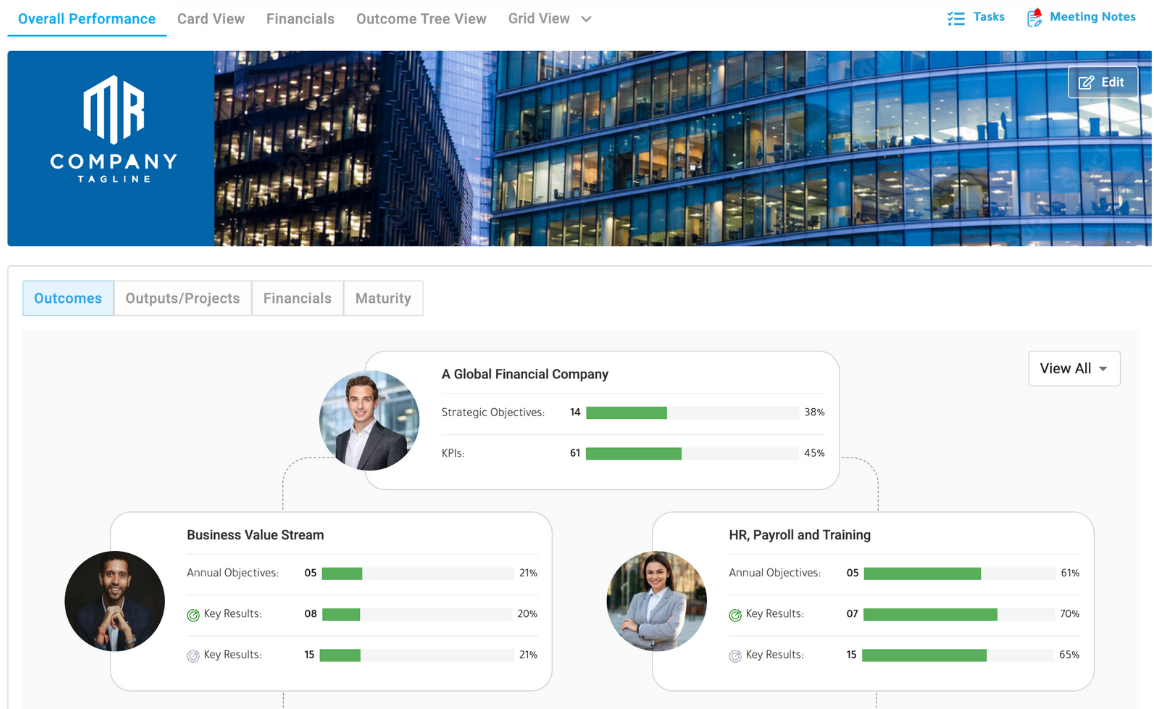
Overall Performance: Executive level visual dashboard that enables end to end tracking of strategy execution at every level (outcomes, output, obstacles, financial & maturity tabs).
-
Grid View and Outcomes Tree: Ability to drill down to specific objectives, key results and quickly see target vs actual progress with color coding
-
Dashboards: View customizable leadership and team level dashboards with score card widgets
-
Overall Strategy Progress bar: Customize the formula for how we calculate overall strategy
-
EVR: Print visual Cards for the Enterprise Visibility Room and monthly Walk the Wall
Product/Service Management Module
- Define Products or Services: create a card to define for each team the products or services they provide using the customized template provided.
- Define custom value chains/value streams for each team so they can visualize how their product/services are moving through the steps
- Visualize time to value metrics: cycle time (how long each step is taking on average) and lead time (how long the card has been in progress) and use lean/kanban to optimize the flow of value.
- View dashboard that summarizes highest bottlenecks in each value stream and if average lead and cycle time are going up or down.
Project Management Module
-
Hybrid Methodology Support:
- Supports Agile, Waterfall, and Hybrid methodologies, giving flexibility in project execution while offering consolidated tracking.
-
Annual and Quarterly Roadmaps:
- Real-time visibility into delivery health, tracking timelines, deliverables and key milestones with automated risk alerts.
-
Project Management:
- Ability to create project and initiative cards, create milestones and deliverables/stories, link them all to each other with parent/child relationship for clear traceability
- Automatic updates of progress across all levels (from tasks to milestones to project)
- Team members can track daily tasks within each card
- Task Management: visualize all open/delayed tasks or just My Tasks
-
Financial Management:
- Ability to set target vs. actual spending within each project, and roll-up all project financials to see overall financial health.
-
Reporting and Dashboards:
-
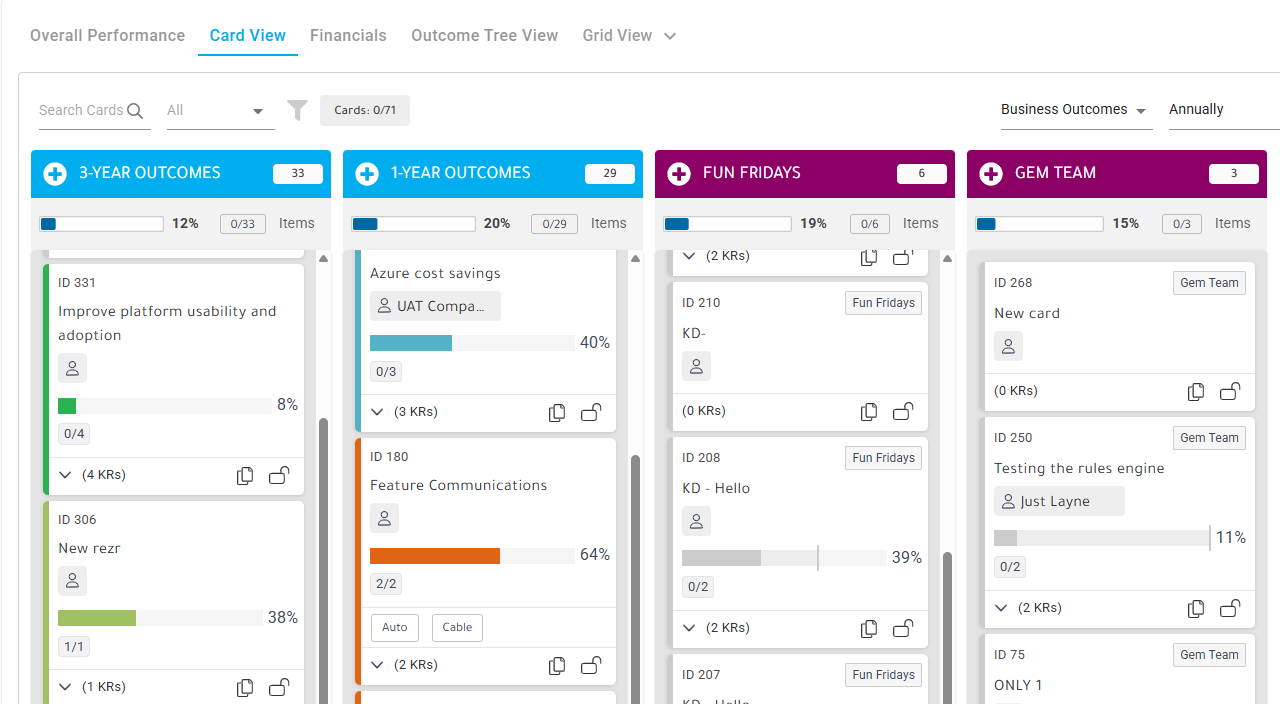
Platform offers several dashboards such as card view, gridview, timeline view, outcomes tree view so you can view data using traditional or modern views
- Create custom tags and create new views across all projects
- Ability to visualize score cards and customize widgets on the leadership and team dashboards. *
-
Risk & Issue/Obstacle Management:
- Automated risk detection based on project performance indicators, with notifications and tracking for potential issues.
Change Management and Maturity Radars Module
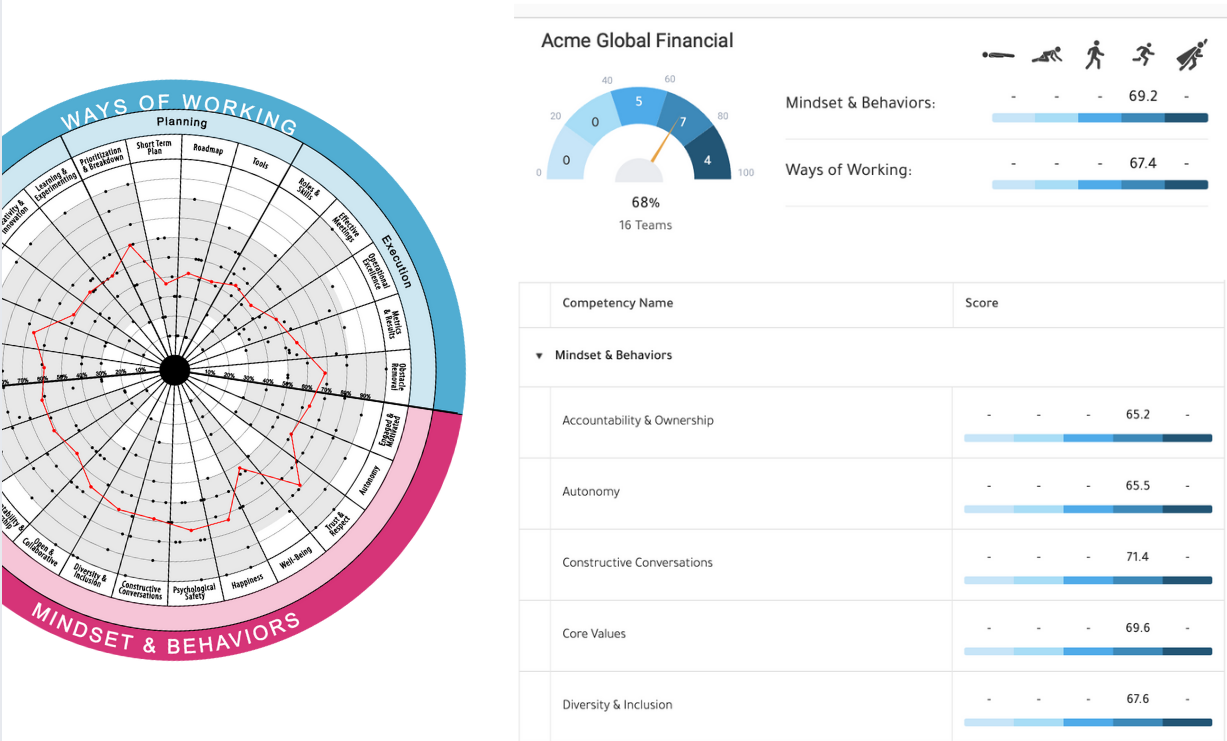
- Leverage the powerful visual radars to run Team Maturity, Product Maturity, Portfolio Maturity, Enterprise Business Agility, Ways of Working and Culture assessments
- Ability to run individual team member feedback radar assessment or design role based competency radar assessments
- Ability to visualize results at the team or rollup across teams and organization
- Ability to build improvement and growth action plans at 3 levels (team, organizational, executive)
- Visualize growth journey over time to see improvements or decline
- Leverage AI to analyze radar results and provide recommendations
- Leverage the Growth Portal to provide targeted recommendations, videos, resources and access to approved mentors and coaches to develop and improve
- Export analysis into professional PDF report, rollup data and leverage AI insights
Manage Team of Teams and Agile Operating Structure Module
-
Visualize Operating Model:
- Design and visualize your team of teams Agile operating model by building cross-functional teams and organizing them around key value chains
- Visualize your hierarchical operating model for sectors and departments
- Switch views between Strategic vs Operational vs Enabling organizations
-
Manage Teams:
- Create teams at different levels, track their name, team purpose/description, work type, team members, team logo or image, language preference, id .etc.
- For each team member track name, email, title, role, allocation % per team, role and expectations of the team member
- Create custom tags such as location, contractor vs employee, tenure .etc.
-
Structural Agility Dashboard:
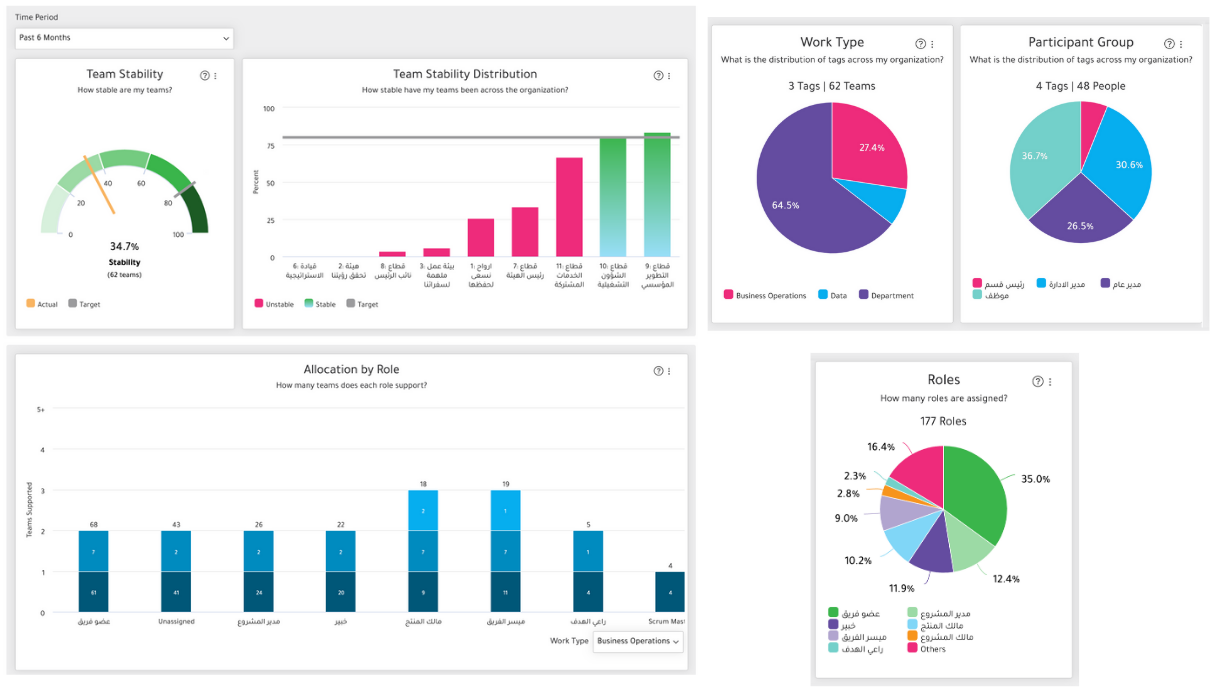
- Visual dashboard with widgets tracking team stability, allocation by role (how many teams is each person on, which roles are gaps), allocation by team
- Visualize team capacity constraints and role gaps
- Visualize overall size of teams, people and roles within a team of teams or sector
- Leverage Ask AI to identify gaps and understand your structure
Click here to take a digital platform tour.

Comments