How are related competencies Identified?
When reviewing the radar results of an assessment, consider which competencies are related and how they impact each other, so that you can find the greatest opportunities for growth. Let’s use the TeamHealth® 3.0 Radar as an example.
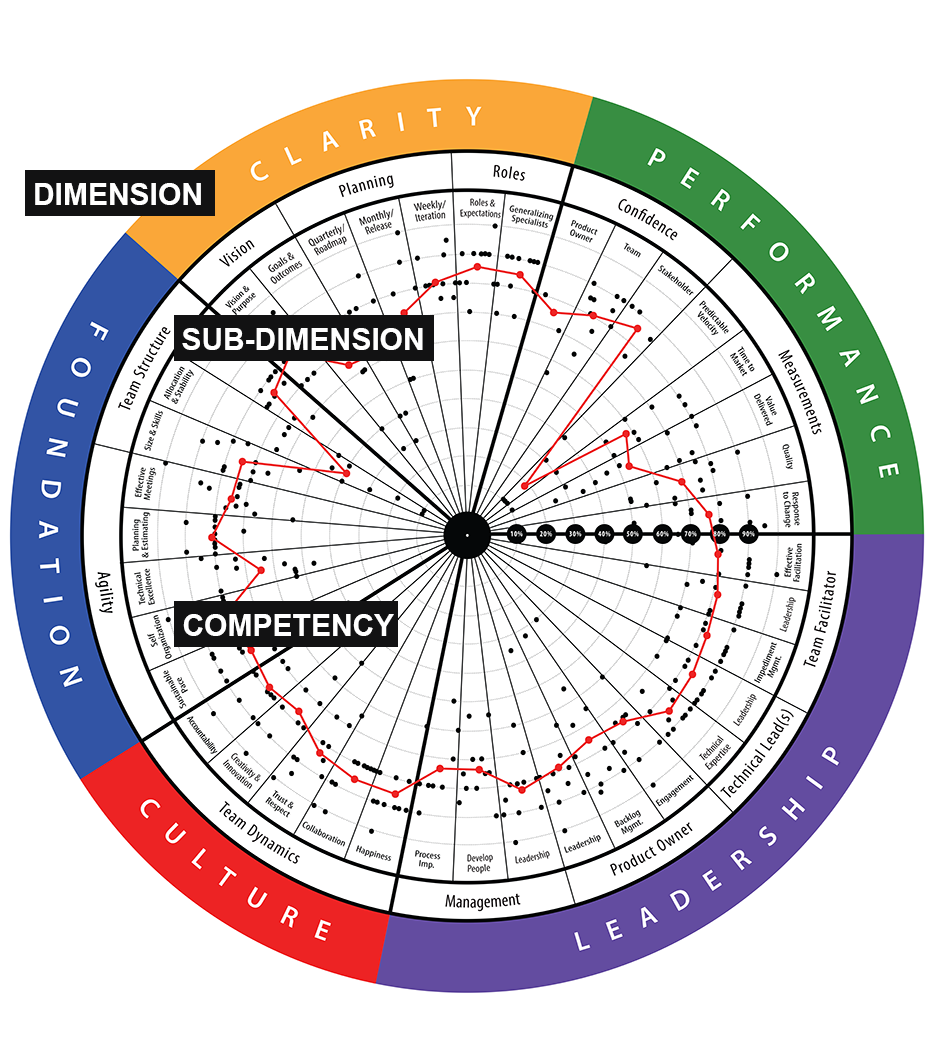
Glossary:
Dimension (5): Major area that we measure for team health, includes Sub-Dimensions and Competencies
Sub-Dimension (12): Grouping of Competencies within a Dimension
Competency (39): Specific area that we measure for team health, through one or more assessment questions
At the highest level, the Dimensions of Foundation, Culture and Leadership can be thought of as inputs to the outcomes of Clarity and Performance. If the team scores themselves lower in one of the inputs, look at the commonly related outcomes to see whether there appears to be a relationship.
Common Patterns:
|
INPUT |
COMMON RESULT |
|
Low scores in Foundation: Foundation includes Agile processes and practices and the way the team is designed (size, stability, allocation) |
Team has challenges with Role Clarity and Performance Measurements, such as Predictable Velocity, Time to Market, Quality and Response to Change |
|
Low scores in Culture: Culture includes Team Dynamics around happiness, trust and respect and how they collaborate and hold each other accountable |
Team has challenges with Role Clarity and how the team works together and issues with Performance Measurements and the team’s Confidence in their ability to meet their goals |
|
Low scores in Leadership: Leadership roles include the Managers that Team Members report to and their Product Owner, Team Facilitator and Technical Lead |
Team has challenges with Clarity around the vision, purpose and plan for the team and issues with Performance Measurements such as Product Owner and Stakeholder Confidence and Value Delivered |
Tip: Context matters! Use these common patterns as a guide, but the textual responses and team discussion provide the additional context that is needed to identify the most powerful growth items for the team and organization to focus on. Check your assumptions and gather multiple data points to understand the whole story.
Examples of Related Competencies:
In addition to the above high-level patterns, we often see relationships between specific competencies.
For a TeamHealth assessment, check the competencies in the Performance Dimension and the Happiness competency to see how strong the team is in relation to the top drivers for those metrics. Learn how to see top drivers for team performance.
The table below gives some examples of what to look for when you are trying to identify related competencies.
|
LOW SCORE |
COMMON IMPACTS |
DESCRIPTION |
|
Team Structure:
|
Team Dynamics:
Measurement:
|
Team members are allocated across multiple teams, are moved frequently between teams or pulled away to work on special assignments. This impacts the ability of the team members to develop strong working relationships and the team can’t reliably predict what they can deliver. The team is not working together to ensure quality. |
|
Product Owner:
|
Vision:
Planning:
Measurement:
|
The PO is not available to the team, and/or does not have training and skills needed for the role. The team feels disconnected from the business vision, doesn’t understand their customer/ stakeholder needs and lacks clarity on the plan for features and how they fit in with the big picture. They are not sure whether their deliverables are providing value. |
|
Team Facilitator:
|
Agility:
Team Dynamics:
Measurement:
|
The Team Facilitator’s skills, approach and/or availability are impacting team collaboration and communication and how the team plans and delivers. The Team Facilitator is not protecting the team from distractions or effectively resolving and escalating impediments. Team dynamics are unhealthy and the Team Facilitator does not know how to support conflict resolution and develop accountability within the team. |
|
Technical Lead(s):
|
Agility:
Measurement:
|
Team members are not receiving guidance and mentorship toward the technical vision and best practices. Technical impediments increase time to market and/or impact quality. |
|
Management:
|
Role Clarity:
Agility:
Team Dynamics:
Measurements:
|
Management has a strong impact on culture and whether the team has the support they need to become high-performing. If managers are being too directive, the team is not able to self-organize and build accountability within the team. This may also impact creativity & innovation and individual and team growth. If managers are too disconnected and are not removing impediments and creating process improvements, happiness, performance and quality are likely to be impacted. |
|
Agility:
|
Team Dynamics:
Confidence:
Measurements:
|
Commitments are being made for the team, and/or team members are being directed to specific tasks and not allowed to self-organize. The team is pressured to take on more work than they can complete at a sustainable pace, which creates technical debt and quality issues. Team members have limited time or space for creativity, innovation or process improvement. |
Comments